Bikeability
A bikeable connection provides a safe and efficient route for bikers, young and old, experienced and novice, to go about their daily activities and explore their community. Connecting the areas where people live, work and play with options for active transportation is a key strategy for increasing opportunities for physical activity. Increasing the “bikeability” of a route is one example of a built environment factor which can impact the health of Tennesseans.

Why is physical activity important?
What are the benefits of active transportation and bikeable environments?
What makes a route bikeable?
How to assess the bikeability of a community?
What can individuals do to increase their comfort with biking?
What can communities do to increase their bikeability?
What does it cost to increase active transportation options in a community?
Government partners
Additional resources
Helpful documents
Why is physical activity important?
According to the Office of Health and Human Services’ Physical Activity Guidelines, regular physical activity in adults has been shown to reduce the risk of early death, coronary heart disease, stroke, high blood pressure, type 2 diabetes, breast and colon cancer and depression. Additionally, physical activity in children and adolescents can improve bone health, improve cardiorespiratory and muscular fitness, decrease levels of body fat and reduce symptoms of depression.
What are the benefits of active transportation and bikeable environments?
Active transportation is getting around using human energy such as riding a bike. According the Centers for Disease Control and Prevention’s Transportation Recommendations, “Expanding the availability of, safety for and access to a variety of transportation options and integrating health-enhancing choices into transportation policy has the potential to save lives by preventing chronic diseases, reducing and preventing motor-vehicle-related injury and deaths, improving environmental health, while stimulating economic development and ensuring access for all people.”
Transportation, the built environment and health are connected. Roadways and intersections designed with all users – including pedestrians, bicyclists, public transportation users and privately owned vehicles – in mind can reduce motor vehicle, pedestrian and bicyclist injuries. The availability of multiple transportation options can also increase social capital and improve mental health by reducing the stress associated with car commuting.
What makes a route bikeable?
Several factors that might determine whether or not someone might use a bicycle for a particular trip – distance, fitness, weather, personal preference and motivation, the safety of the physical environment and even the esthetic appeal of the environment. Other factors can be just as important to bikeability, for example:
- Are you picking up the kids from school on your way home from work?
- Are there amenities to encourage biking along the way, like water fountains?
- Are there places at your destination to lock your bike?
How to assess the bikeability of a community?
The National Highway Traffic Safety Administration (NHTSA), Pedestrian and Bicycle Information Center and the Federal Highway Administration created a bikeability checklist (PDF), which can be used to objectively assess and compare the bikeability of specific communities.
There are many other assessment and education tools available online. The Institute for Local Government has several tools. Check with your local walking/biking advocacy organization for more.
What can individuals do to increase their comfort with biking?
- Plan ahead of time to use the most bikeable route to reach your destination.
- Increase your visibility by using lighting and reflective or light-colored clothing.
- Wear a helmet.
- Understand and obey traffic signals and laws.
- Ride responsibly and predictably.
- Connect with other bicyclists in your community.
- Participate in local planning and community meetings.
- Connect with local advocacy groups and transportation agencies.
- Just do it - the more you ride, the more comfortable you will be with riding.
What can communities do to increase their bikeability?
- Assess routes for bikeability, using valid instruments.
- Consider which routes are key connectors for your community and make changes to the physical environment strategically. Don’t forget bridges and tunnels!
- Potential changes to the physical environment include:
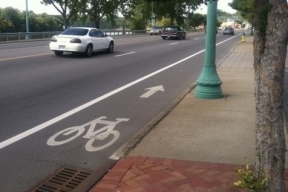
- Increasing signage and painting on the roadway to remind drivers of the possibility of cyclists in the lane (often known as “sharrows”), conventional bike lanes (which provide a space exclusively for cyclist-se), buffered bike lanes (which are similar to conventional bike lanes, but provide additional space between the cyclist and motor vehicle traffic) and lastly protect bike lanes (which provide a physical barrier between the cycle traffic and motor vehicle traffic,
- Improving lighting to increase visibility,
- Improving the road surface to reduce potholes, cracked or broken pavement and dangerous grates or utility access points,
- Increasing roadway surface maintenance to reduce debris (glass, sand, trash) and
- Providing racks for securing bicycles.
- Potential policy solutions include
- changing speed limits,
- enforcing pedestrian right-of-way laws and
- adjusting the timing of stoplights at intersections to allow pedestrians and bicyclists enough time to safely cross.
- Advocate for roadway repairs and new initiatives to take into account all users – including pedestrians, bicyclists, public transportation users as well as those operating private vehicles – regardless of income, age or ability.
- Keep environmental justice and social equity in mind when assessing the potential health effects of a proposed transportation initiative or policy.
- Consider the impact of development patterns and zoning codes on the placement of homes, schools and workplaces and transportation between these key locations.
What does it cost to increase active transportation options in a community?
There are lots of data available regarding the costs and benefits of a variety of built environment interventions. The Rails to Trails Conservancy published a report in 2008 entitled “Active Transportation for America”, which estimated the annual value of walking and biking across the country at:
- $4 billion in gasoline not purchased
- 14 million tons of carbon dioxide not emitted (conservatively worth $147 million)
- $235 billion saved due to the health benefits from active transportation that result in the prevention of premature deaths
CDC’s Built Environment and Health Initiative (also known as the Health Community Design Initiative) found:
- Investments in transportation infrastructure, such as off-street trails, dedicated bicycle lanes and pedestrian bridges promote health and save money. For every dollar invested in these projects, between $1.20 and $3.80 is saved as a result of reduced health care utilization and fuel consumption
The costs of specific projects will vary greatly from city to city and state to state. The Pedestrian and Bicycle Information Center has created a report and database, called Costs for Pedestrian and Bicyclist Infrastructure Improvements: A Resource for Researchers, Engineers, Planners, and the General Public, which provides “meaningful estimates of infrastructure costs by collecting up-to-date cost information for pedestrian and bicycle treatments from states and cities across the country.”
Government partners
Tennessee Department of Transportation
Bicycle and Pedestrian Program
www.tn.gov/tdot/multimodal-transportation-resources/bicycle-and-pedestrian-program.html
Tennessee Traffic Laws Relating to Bicycles
www.tn.gov/tdot/multimodal-transportation-resources/bicycle-and-pedestrian-program/resources11/tennesse-pedestrian-laws.html
Centers for Disease Control and Prevention (CDC)
Healthy Places
www.cdc.gov/healthyplaces
Transportation HIA (Health Impact Assessment) Toolkit
www.cdc.gov/healthyplaces/transportation/hia_toolkit.htm
Community Strategies
www.cdc.gov/physicalactivity/community-strategies
U.S. Department of Transportation
Bicycles and Pedestrians
www.transportation.gov/bicycles-pedestrians
Federal Highway Administration Office of Planning, Environment & Realty Bicycle and Pedestrian Program
www.fhwa.dot.gov/environment/bicycle_pedestrian
Transportation and Health Tool
www.transportation.gov/transportation-health-tool
Federal Transit Administration’s Program & Bicycle Related Funding Opportunities
www.fta.dot.gov/13747_14400.html
National Pesdestrian and Bicycle Safety Data Clearinghouse
www.pedbikedata.org/

National Center for Safe Routes to School
Safe Routes
http://www.saferoutesinfo.org
National Complete Streets Coalition
http://www.smartgrowthamerica.org/complete-streets
Pedestrian and Bicycle Information Center
http://www.pedbikeinfo.org/
Bike Walk Tennessee
http://www.bikewalktn.org
Walk Bike Nashville
www.walkbikenashville.org
Greater Memphis Greenline
greatermemphisgreenline.com
American Public Health Association (APHA)
Transportation and Health Toolkit
www.transportation.gov/transportation-health-tool
Smart Growth America
Introduction to Complete Streets Presentation
www.smartgrowthamerica.org/documents/cs/resources/cs-intro.pptx
Complete Streets Local Policy Workbook
www.smartgrowthamerica.org/documents/cs/resources/cs-policyworkbook.pdf
Elements of an Ideal Complete Streets Policy
smartgrowthamerica.org/resources/elements-complete-streets-policy
Bike League of America
Model Legislation Toolkit
bikeleague.org/content/model-legislation-0
National Highway and Traffic Safety Administration
How Bikeable is your Community? (Checklist)
www.nhtsa.gov/people/injury/pedbimot/bike/bikeability/index.htm
Bike Score
www.walkscore.com/bike-score-methodology.shtml
Bike Cleveland
www.bikecleveland.org/bike-cle/news/sharrows-bike-lanes-and-cycle-tracks-whats-the-difference/2015/04/
Helpful Documents
Smart Growth America
Complete Streets Local Policy Workbook
www.smartgrowthamerica.org/documents/cs/resources/cs-policyworkbook.pdf
Elements of an Ideal Complete Streets Policy
www.smartgrowthamerica.org/documents/cs/policy/cs-policyelements.pdf